Link - https://airflow.infopandora.com/
Main UI
Home window
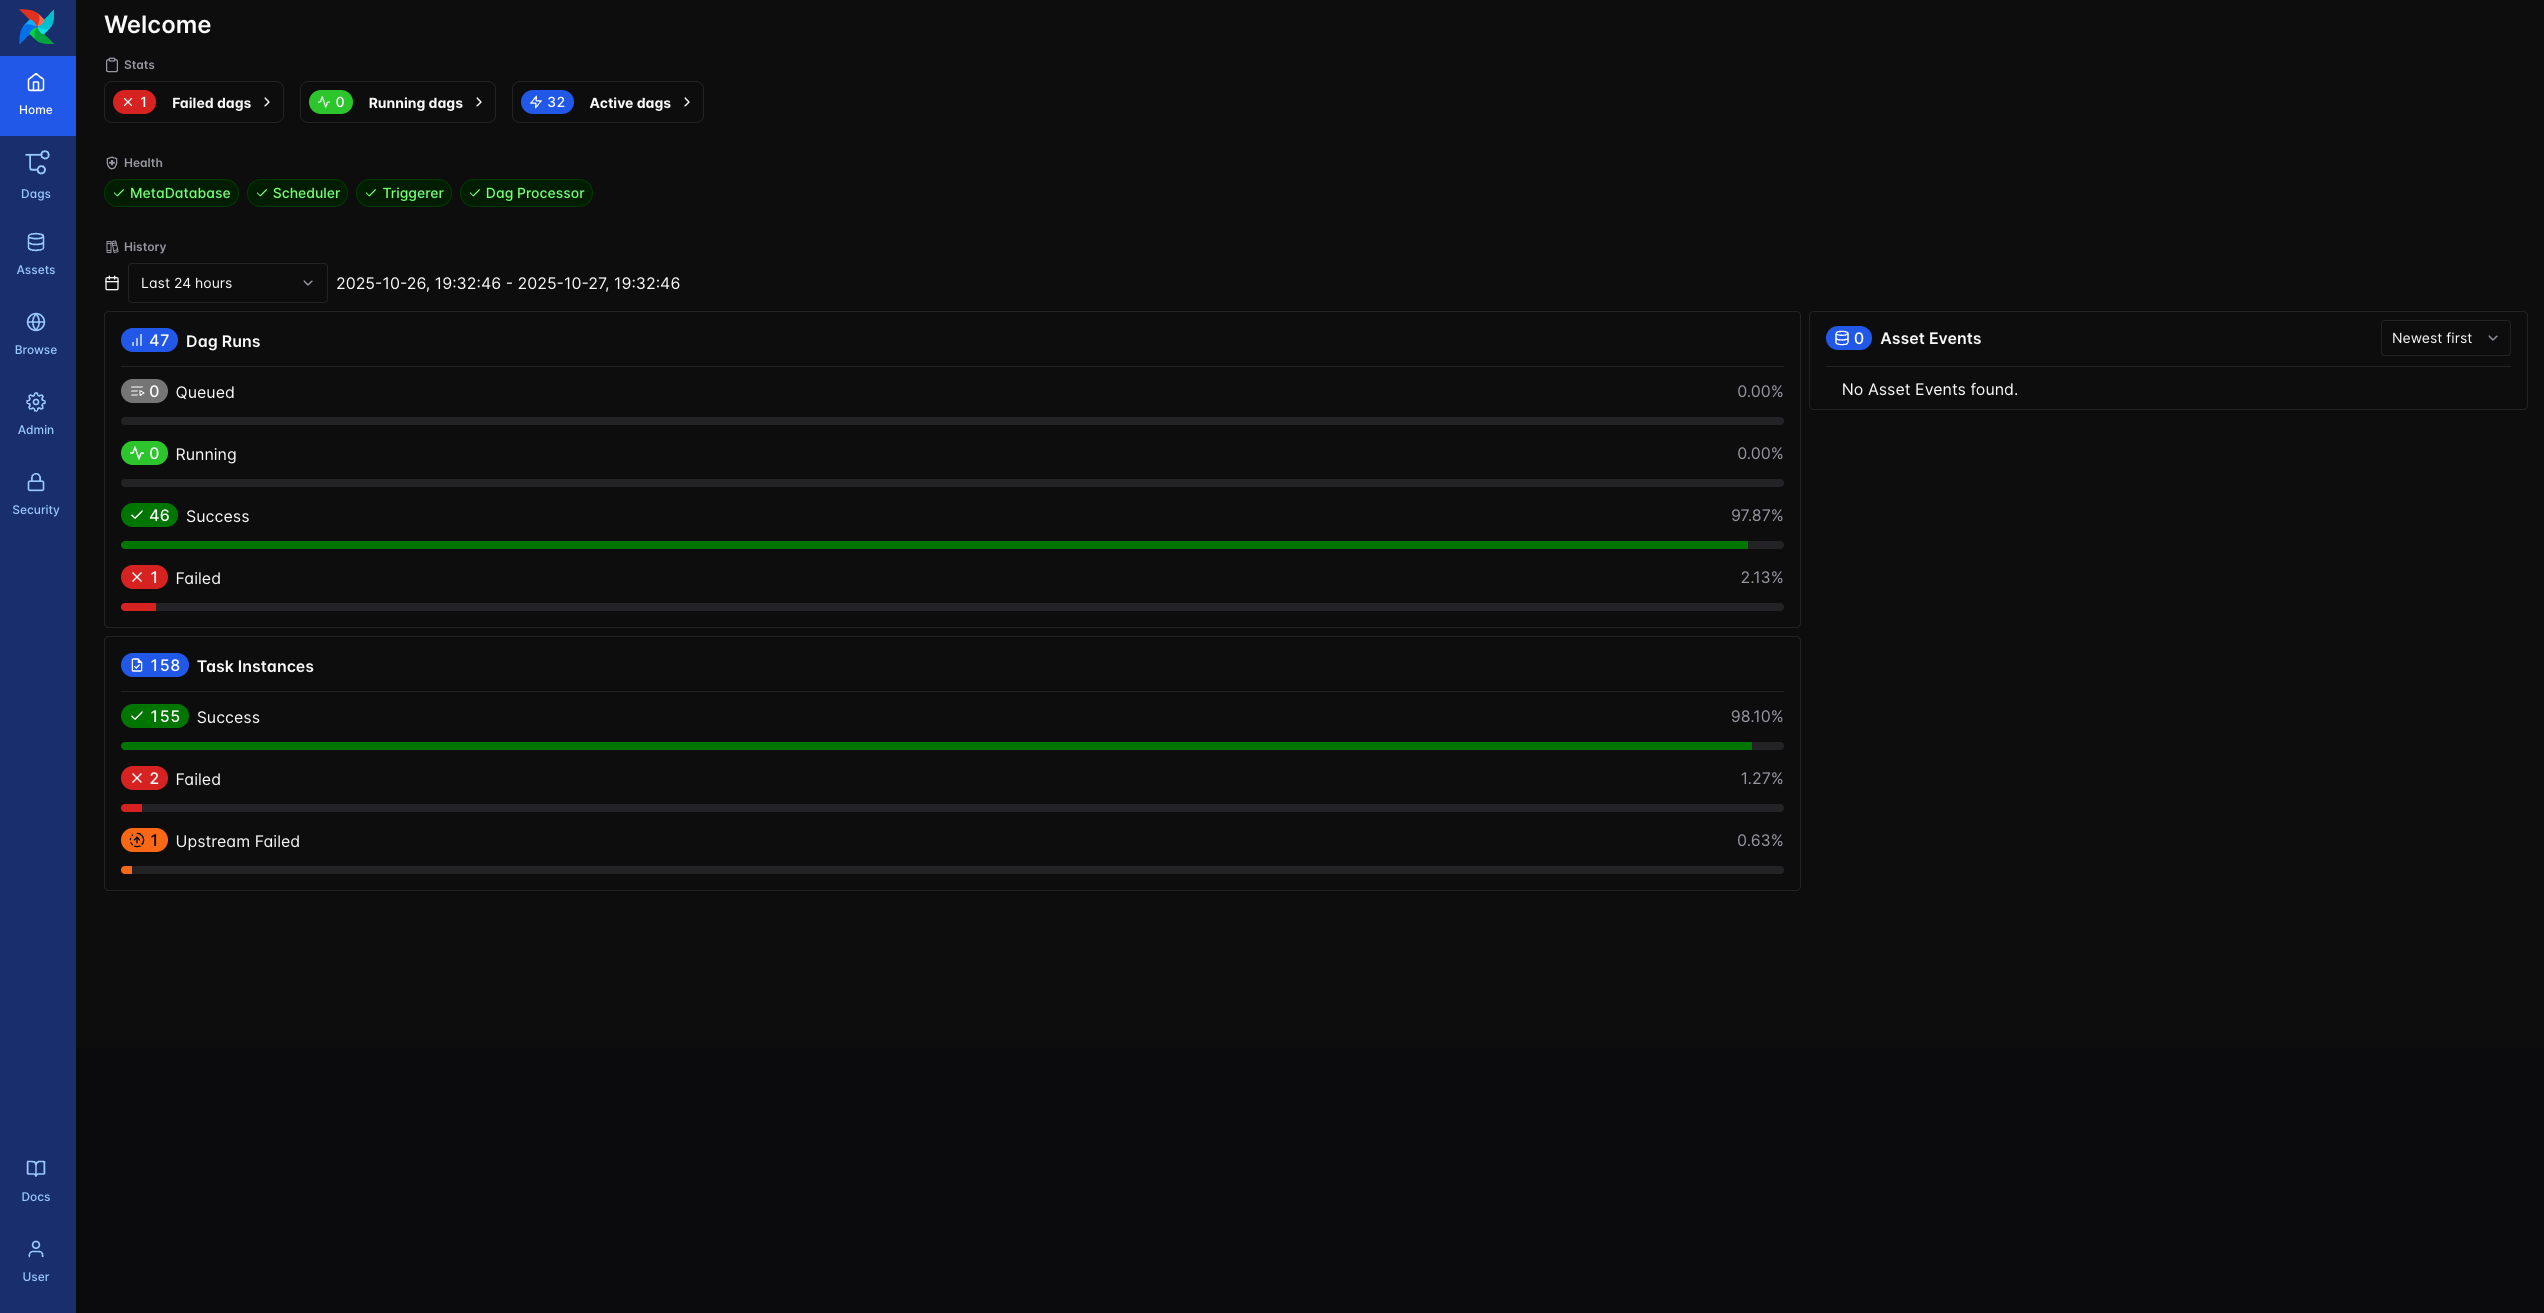
Here there is a brief overview where we can find the statistics on dags - amount of failed/successed runs (top window) and tasks (bottom) and by pressing the corresponding button quickly jump to filtered dags or tasks.
Dags window
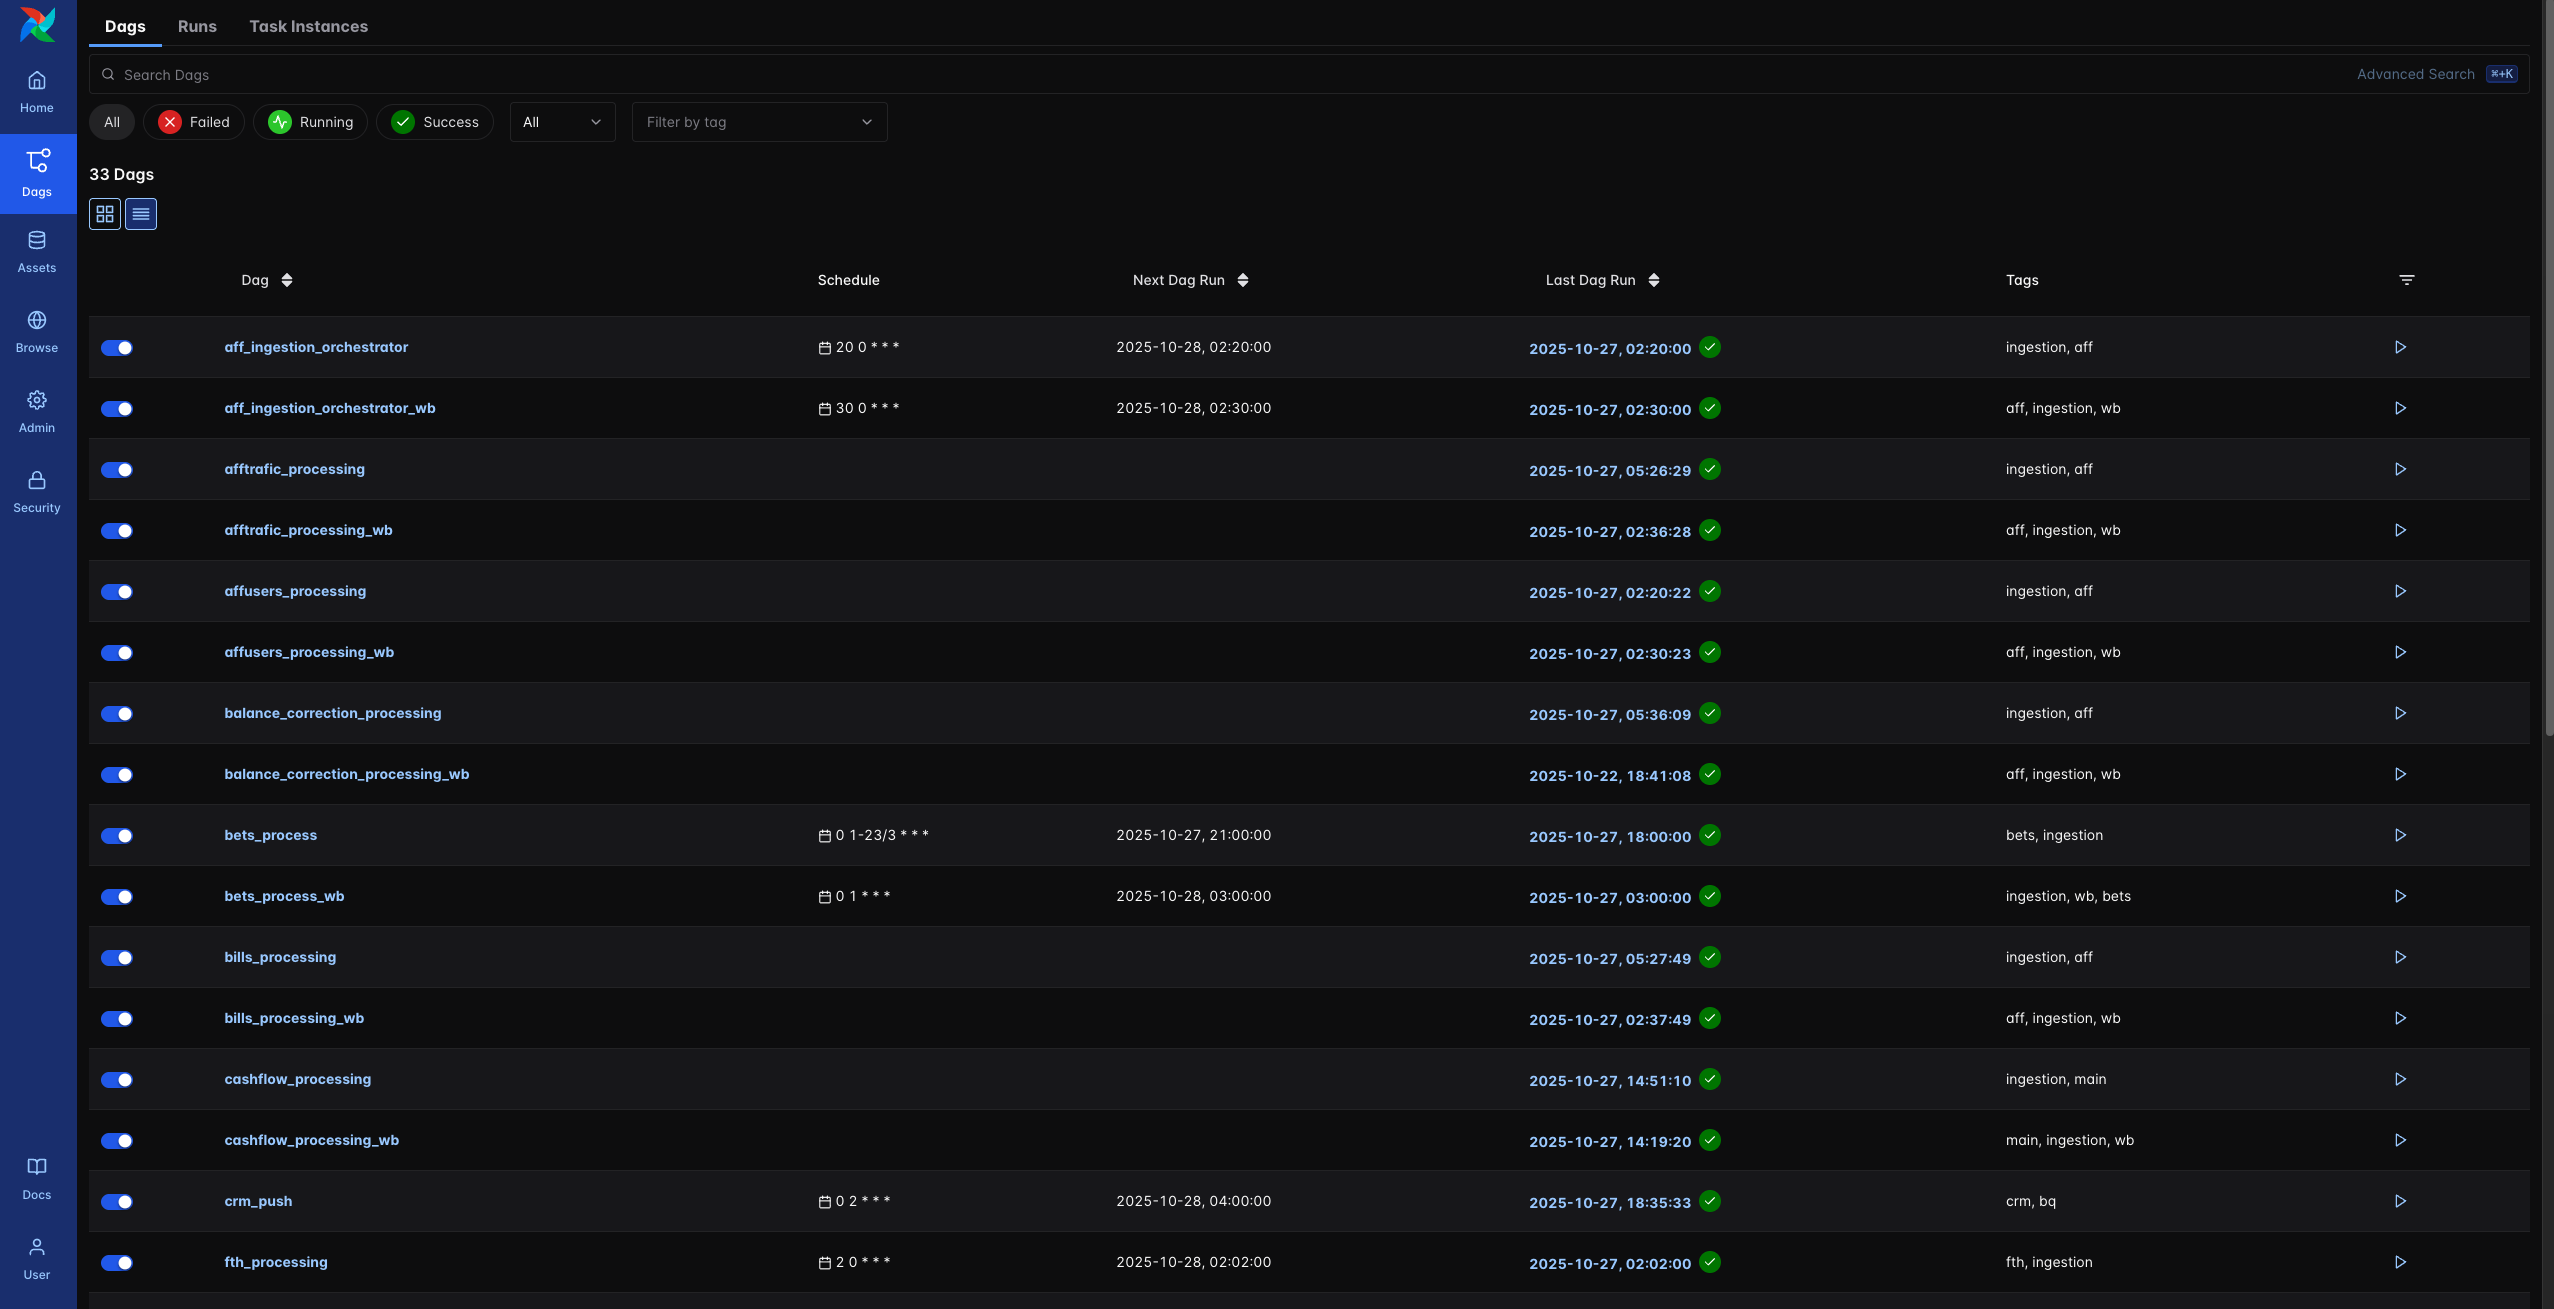
This would be the most relevant page. In here there is detailed info on each dag - State switcher (enabled/disabled), Name, cron expresion (UTC) which is used to calculate next run date by the Airflow Scheduler, if available timestamp of the next run, last status along with the timestamp when it was triggered, tags and a button to trigger the dag manually.
Those which dont have the Schedule and Next Dag Run filled are triggered by the parent dag -
aff_ingestion_orchestrator
aff users
partners
partners stats
aff trafic
bills
balance correction
ingestion_orchestrator
main
users
cashflow
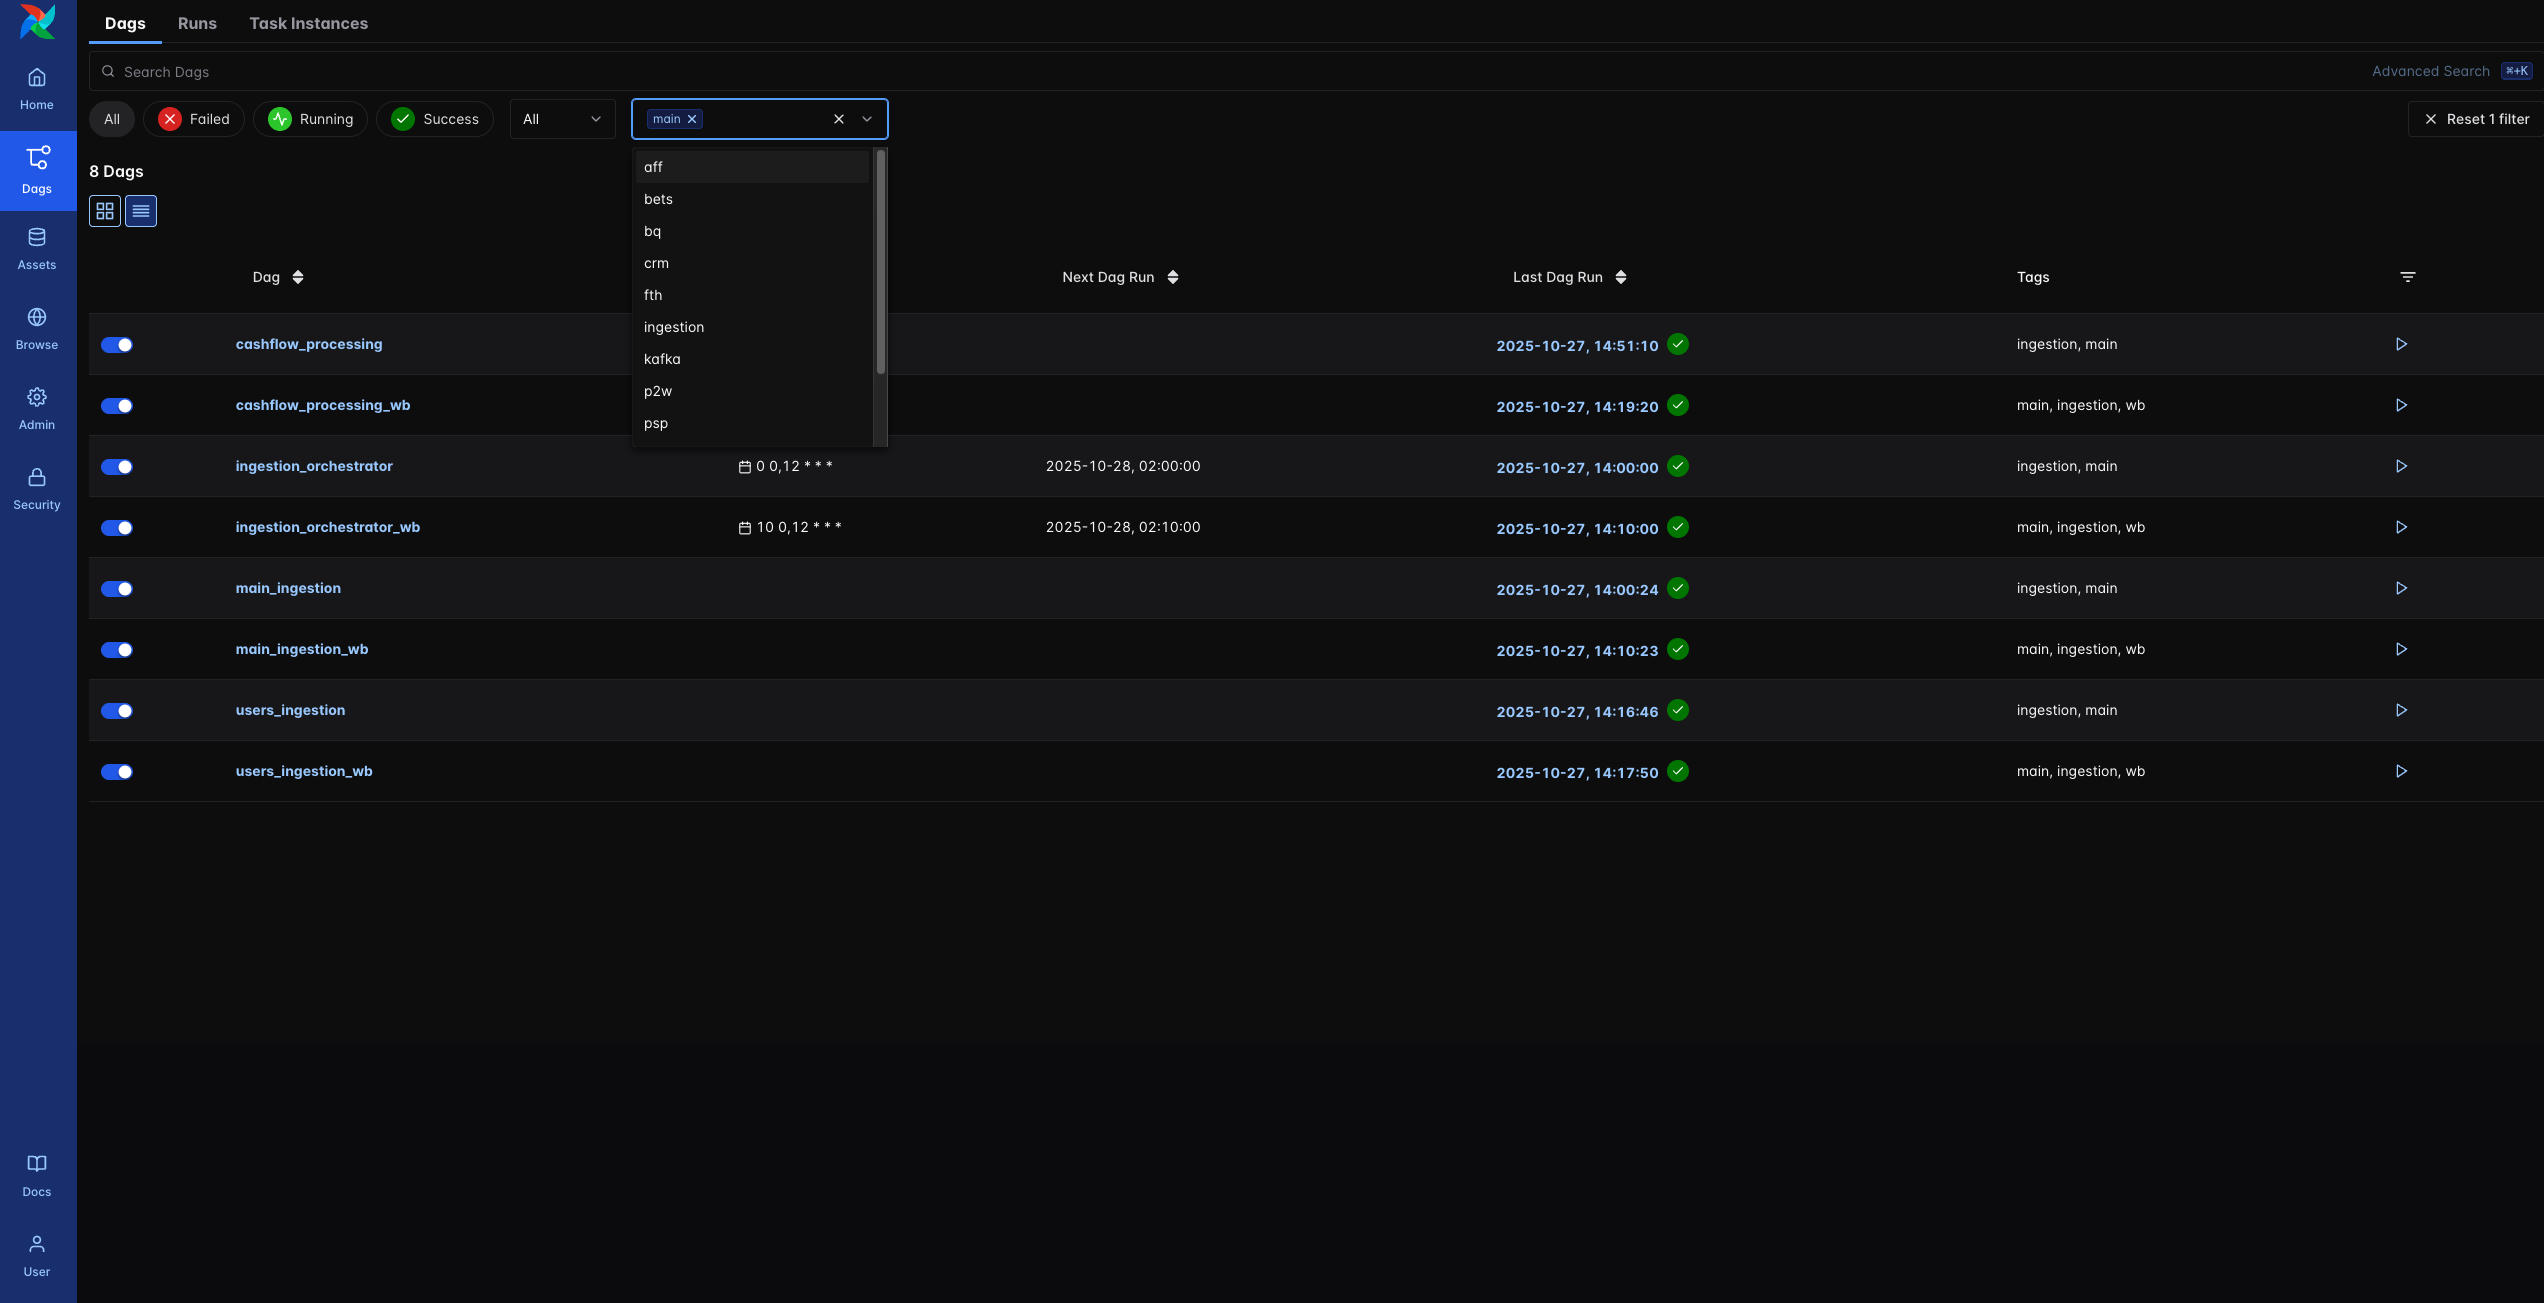
On the top of the page filters can be applied to show dags by their State, Status or tags (multiselection available)
Dag page structure
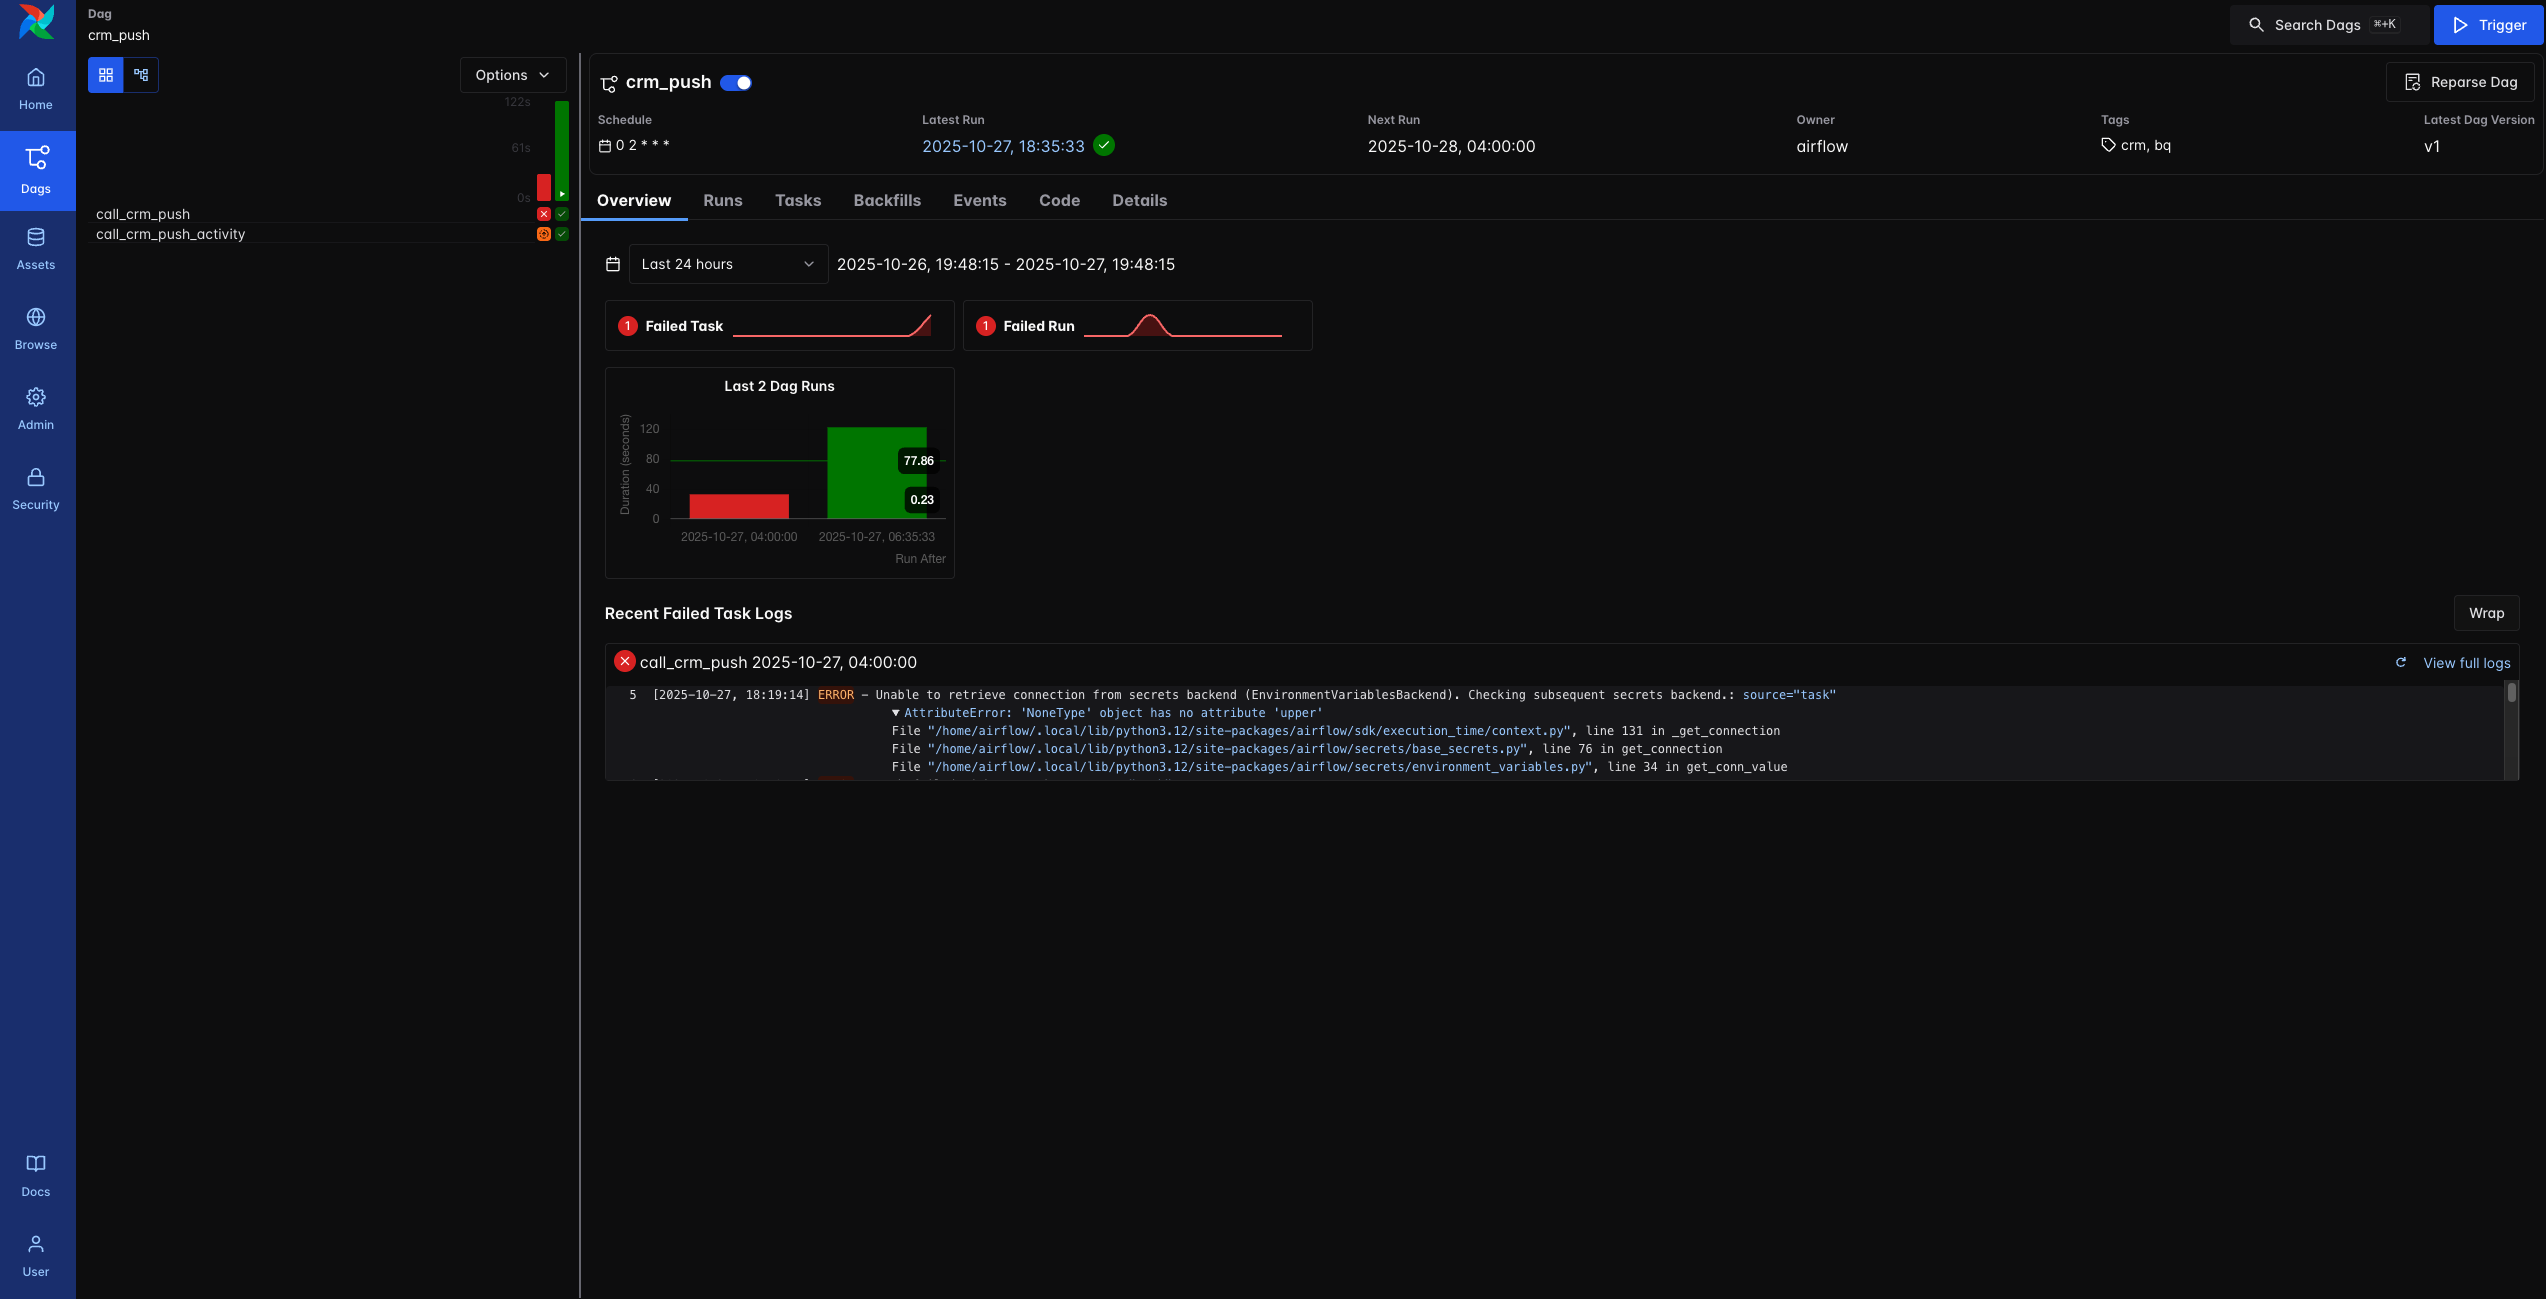
By opening certain dag we can see the detailed info on the runs.
At the left side there is a grid of last runs, their states (queued, running, success, failed, upstream failure) and overal execution time in seconds. In the Options selector we can choose how many runs to show on the grid, by default 10.
Right side of the page contains different tabs:
Overview - quick info on last runs in the selected period (default - 24h) ranging from Last 1 hour to Past week;
Runs - brief info on all runs including Logical run date (uniqie identifier), State, Run Type, Start Date, End Date, Duration and Dag Version;
Tasks - Task Name, State Indicator, Last runs grid;
Backfills - Date range of a backfills, status, start and end times, and number of runs/tasks per backfill;
Events - chronological audit of every importand change: enabling/disabling dag, trigger events, state changes, run creations, in the Extra field we can see parameters for the manual run or another useful information;
Code - as the name suggests current version of dags code;
Details - summary of dag configuration and system-level attributes;
Selecting specific run (vertical bar on the grid) shows almost the same information but run based rather than dag based.
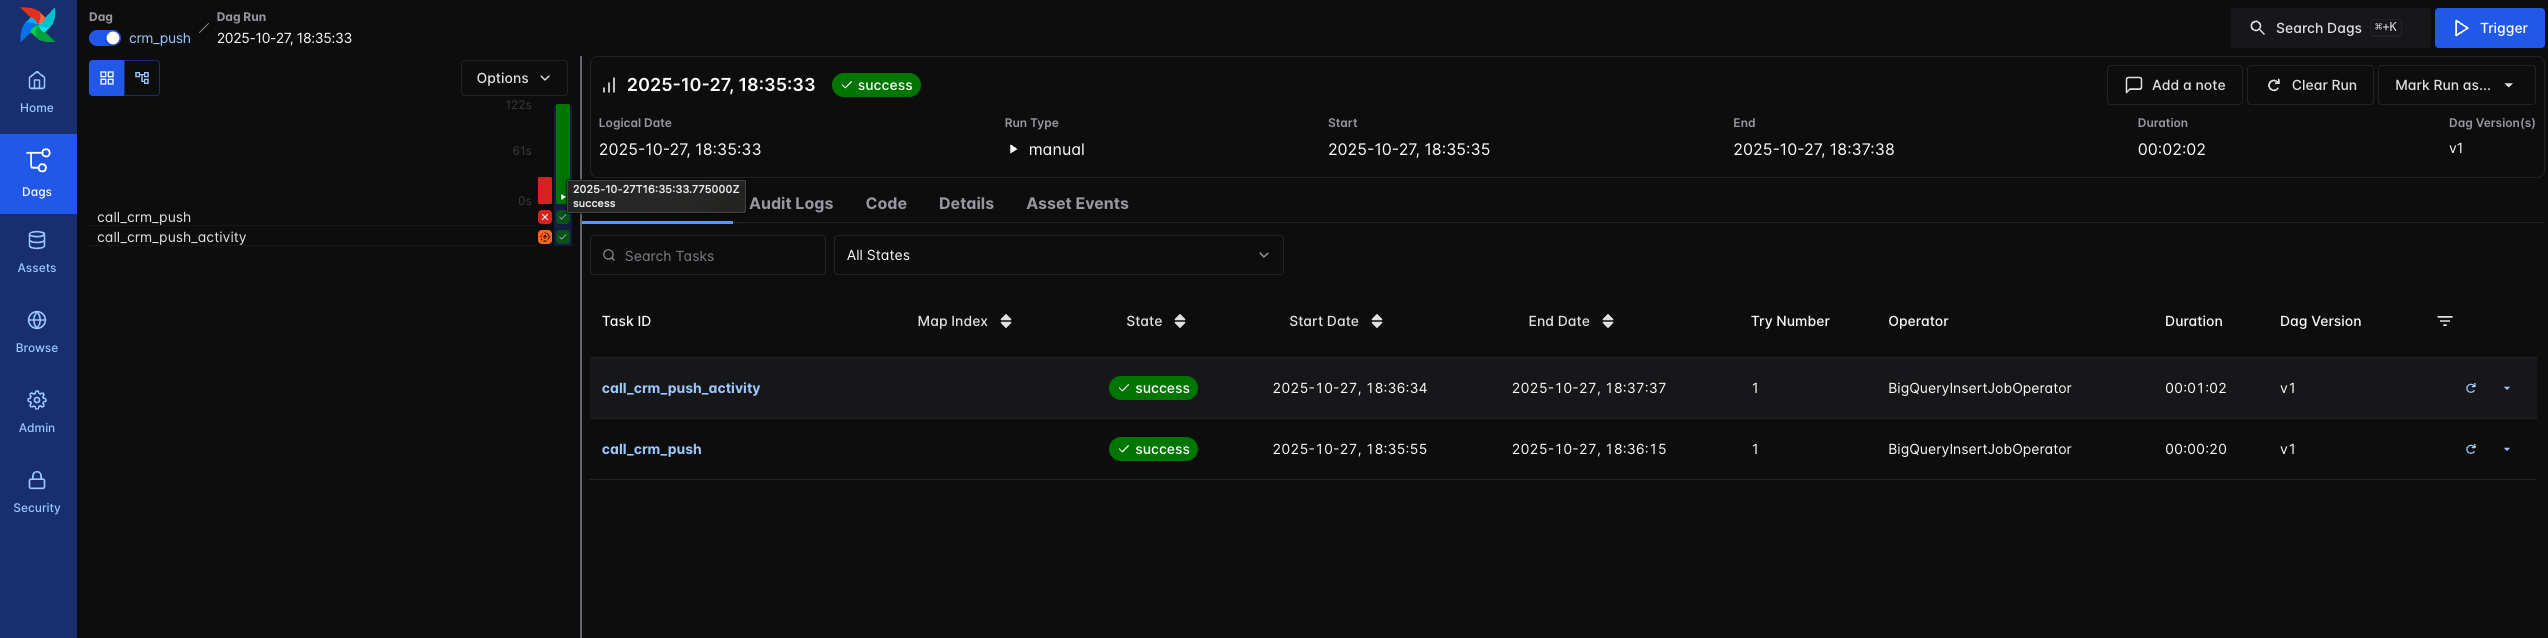
Selecting each task (box under the run bar) shows the most frequently accessed tab - Logs
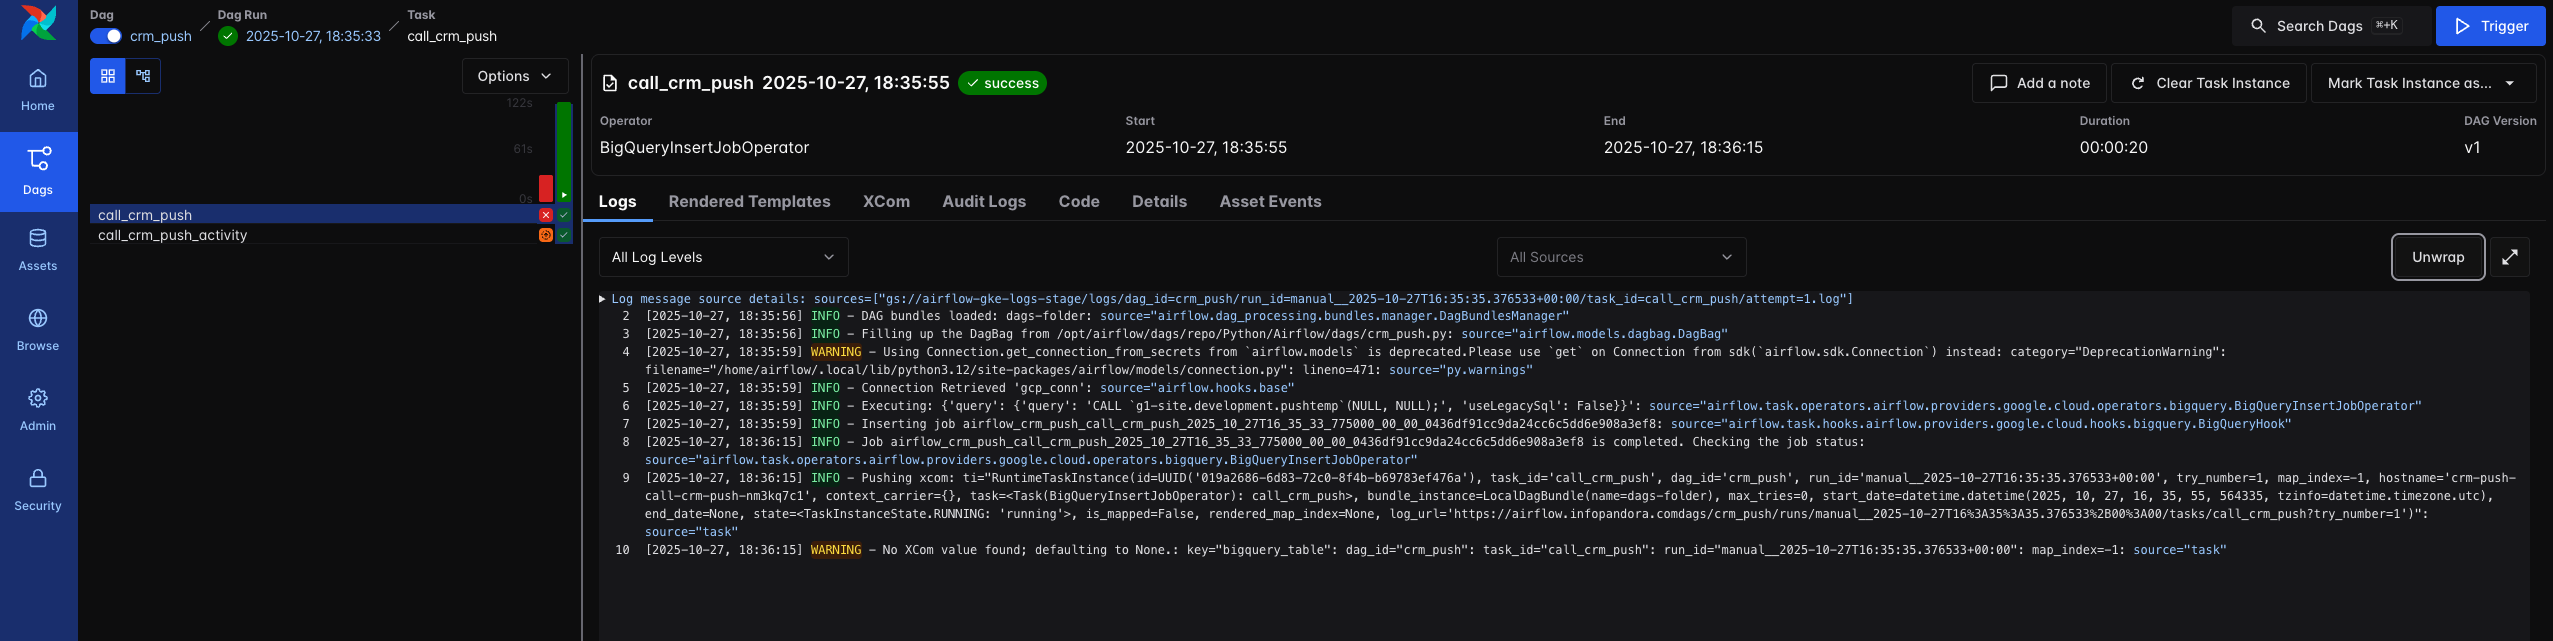
Current example just executes stored procedure on BQ so there would be no logs from the BigQuery only Python code logs will be shown. However in the Details tab (for stored procedure case) there would be link to the run in BigQuery to see the actual logs from database side (sometimes link includes location None so it need to be manually typed to US to actually see the said logs
..call_crm_push_2025_10_27T16_35_33_775000_00_00_0436df91cc9da24cc6c5dd6e908a3ef8!3sNone
..call_crm_push_2025_10_27T16_35_33_775000_00_00_0436df91cc9da24cc6c5dd6e908a3ef8!3sus)
Dag failures
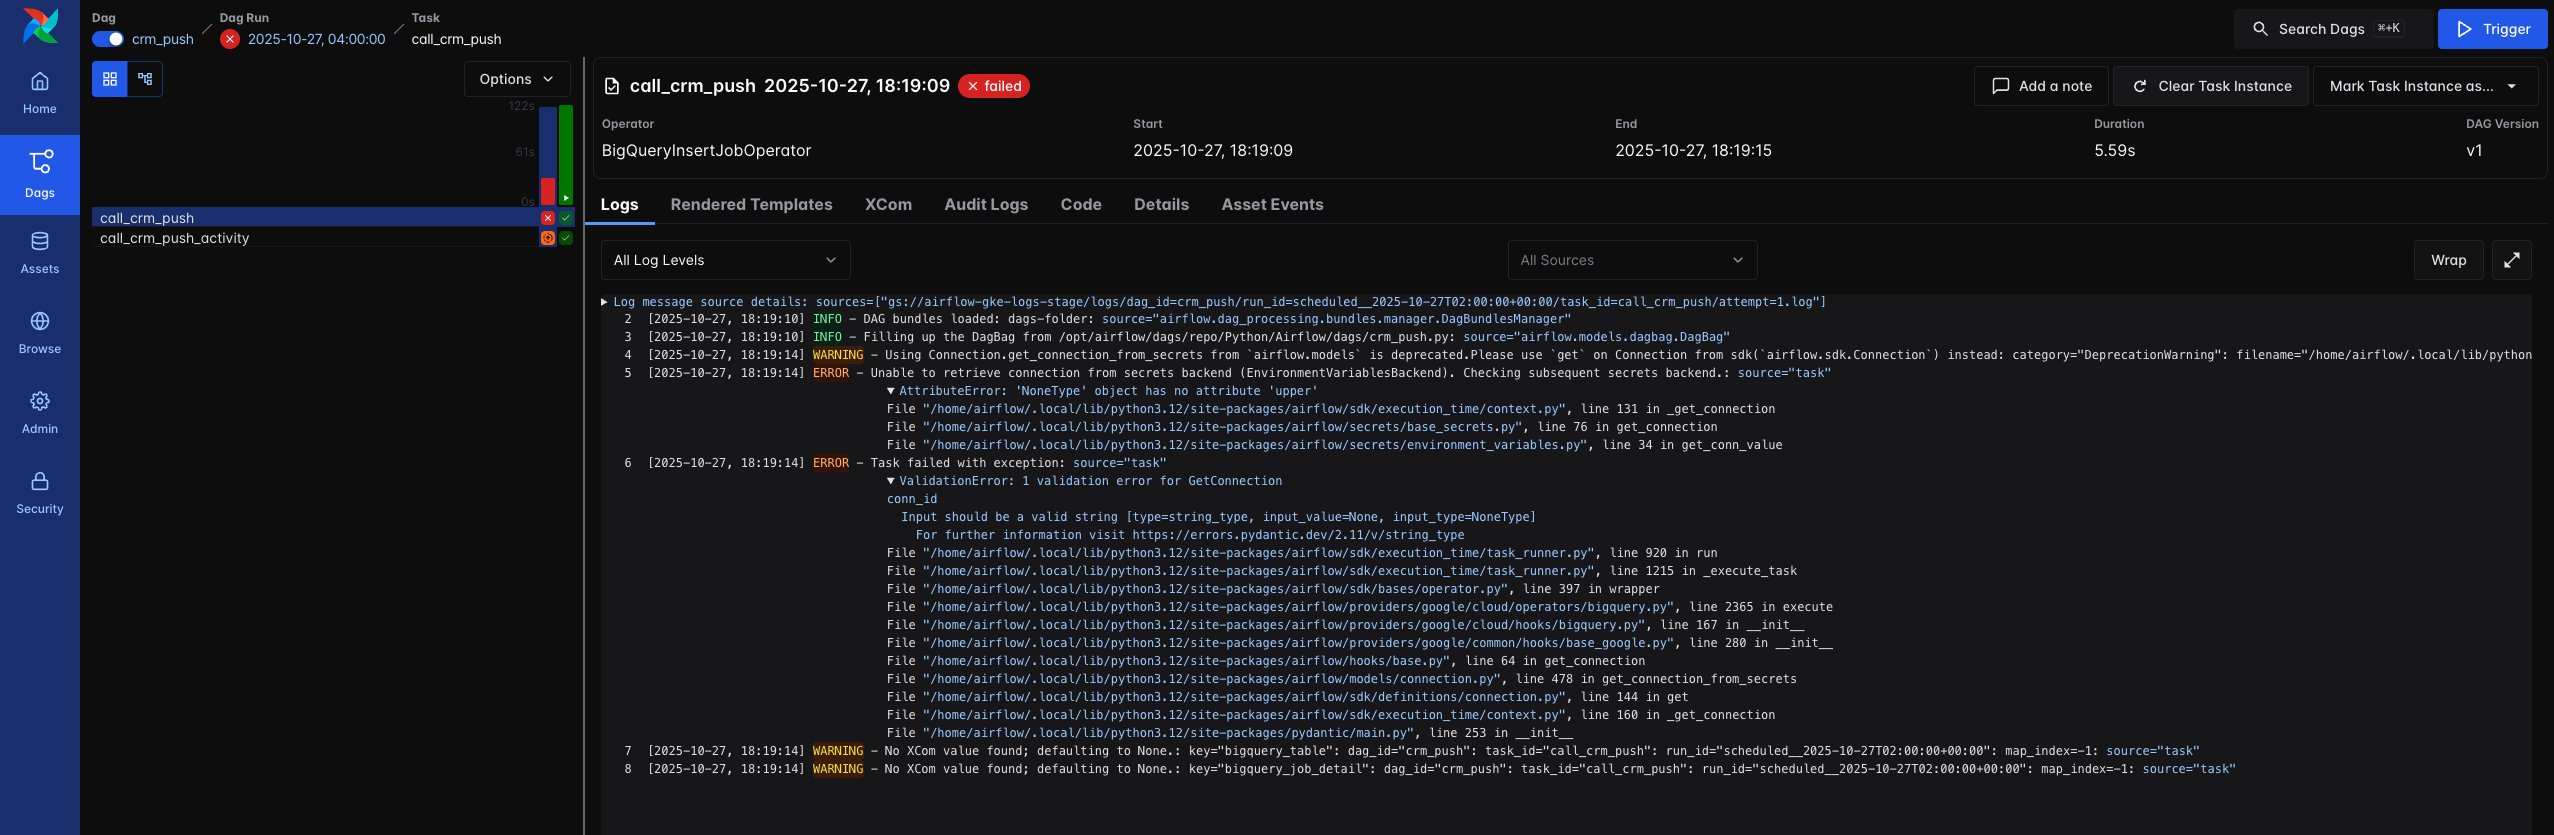
In case of a failure whole run can be triggered again by the Trigger button (if needed for the history parameters can be specified, if parameters are not passed default behavior will be used)
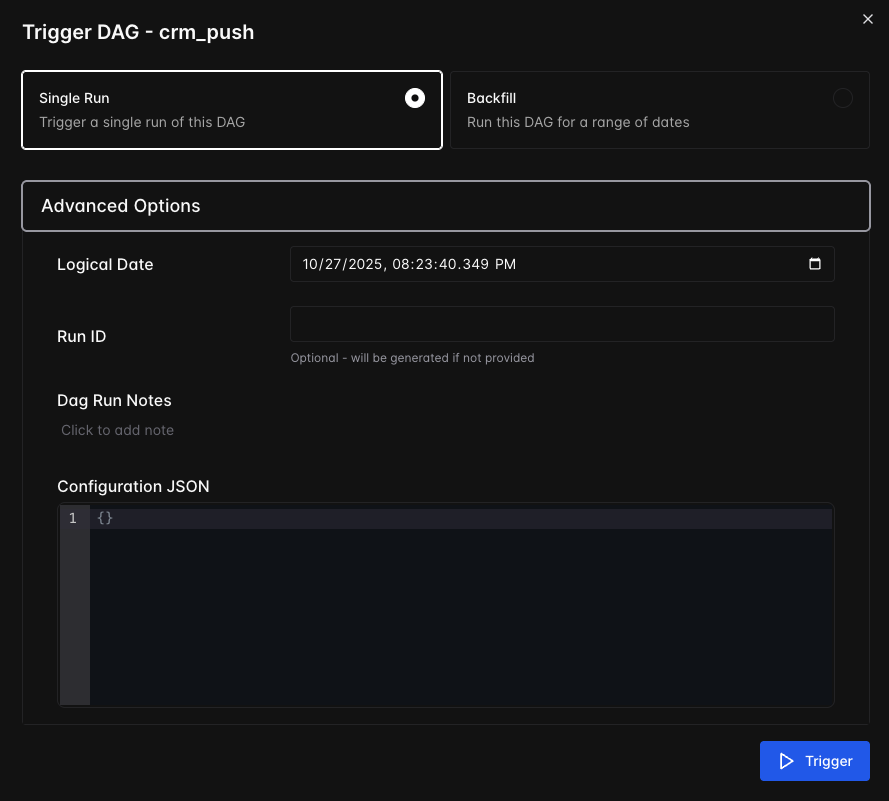
Example of parameters - {
"date_from": "2025-10-07T00:00:00Z",
"date_to": null
}
If dag has many tasks, only one failed and there is no need for the full rerun separate task can be reloaded by pressing Clear Task Instance button.
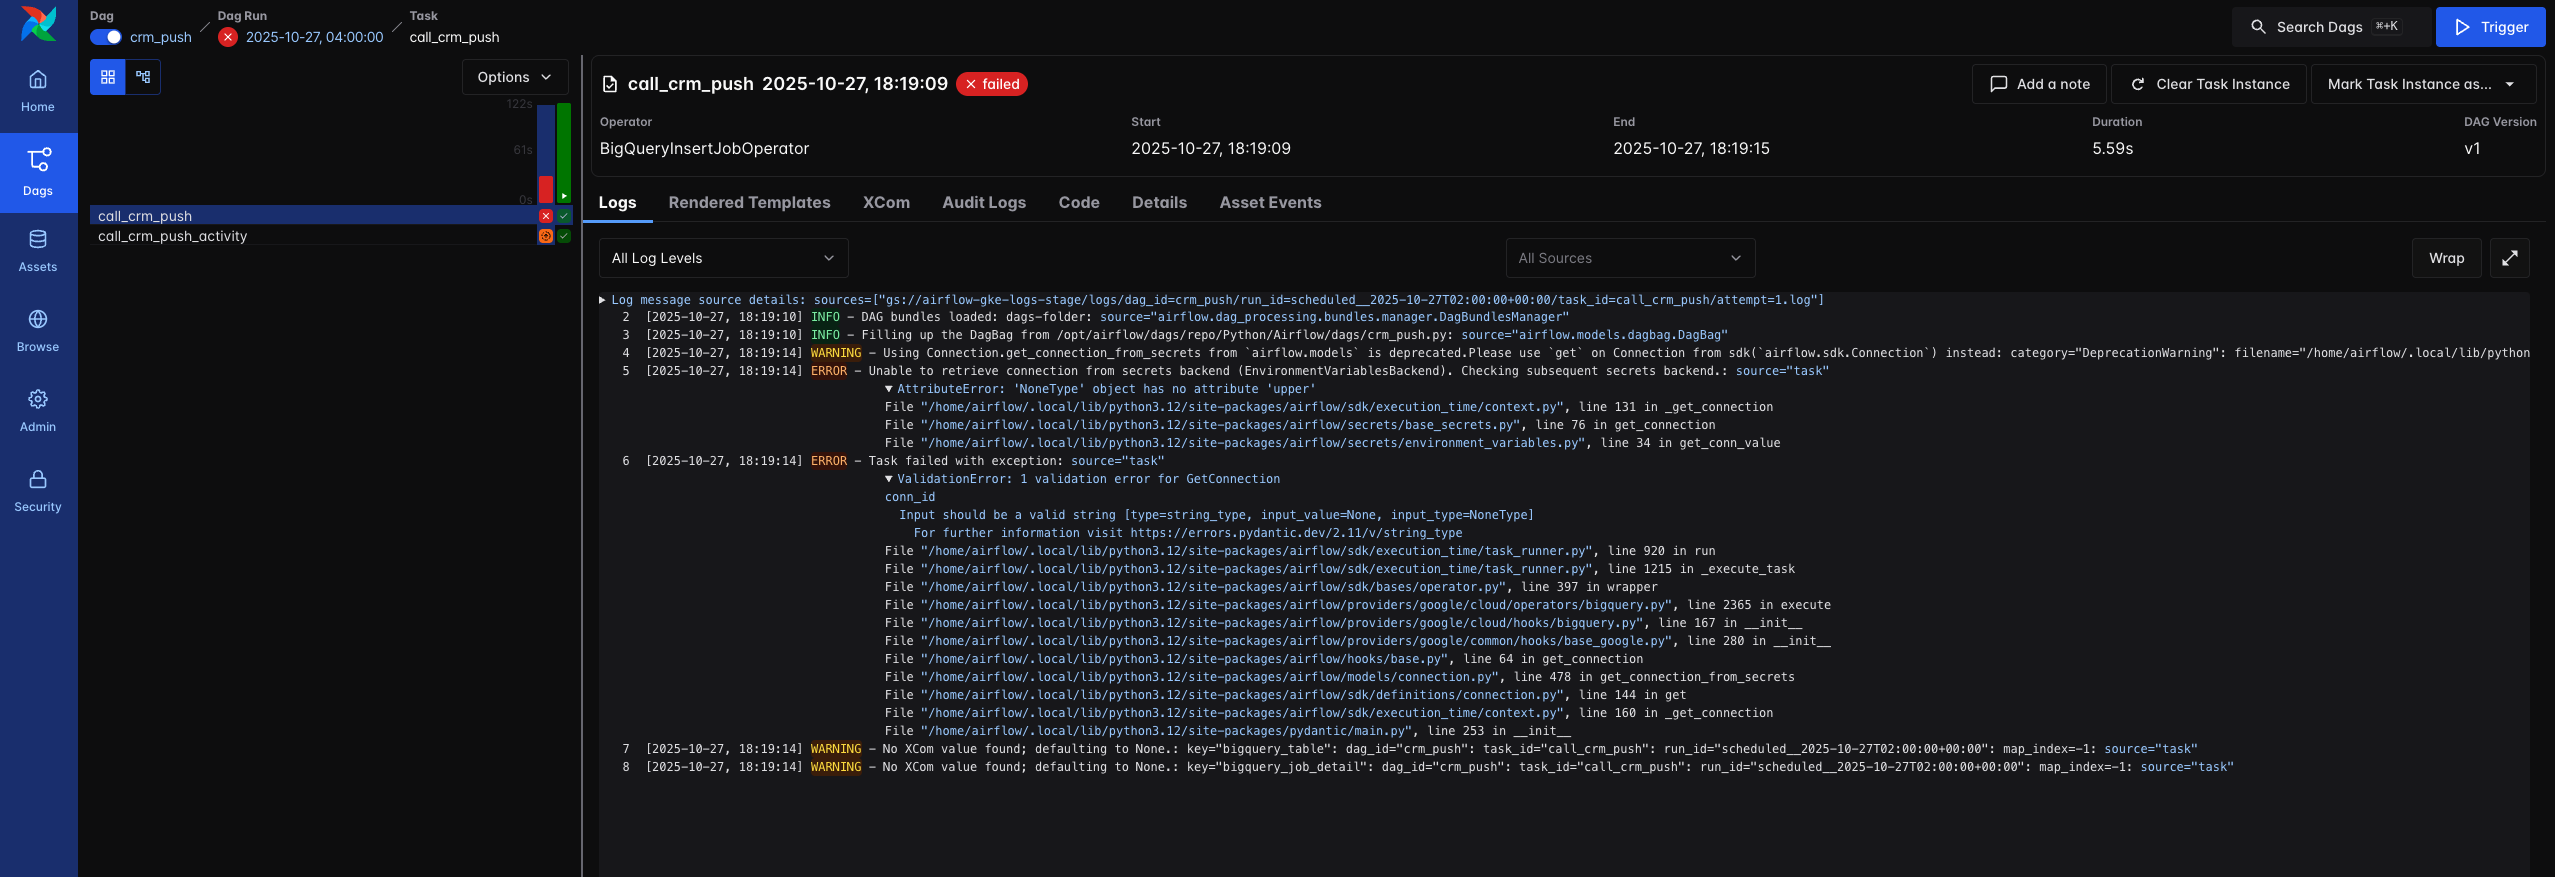
This way new try will be initiated and we will see a separate tab for each one and logs will be preserved in each tab.
Alerting
Implemented using the shared function in the subdirectory in GitHub repository. Alerts will be send to the Slack channel #analytics_alert.
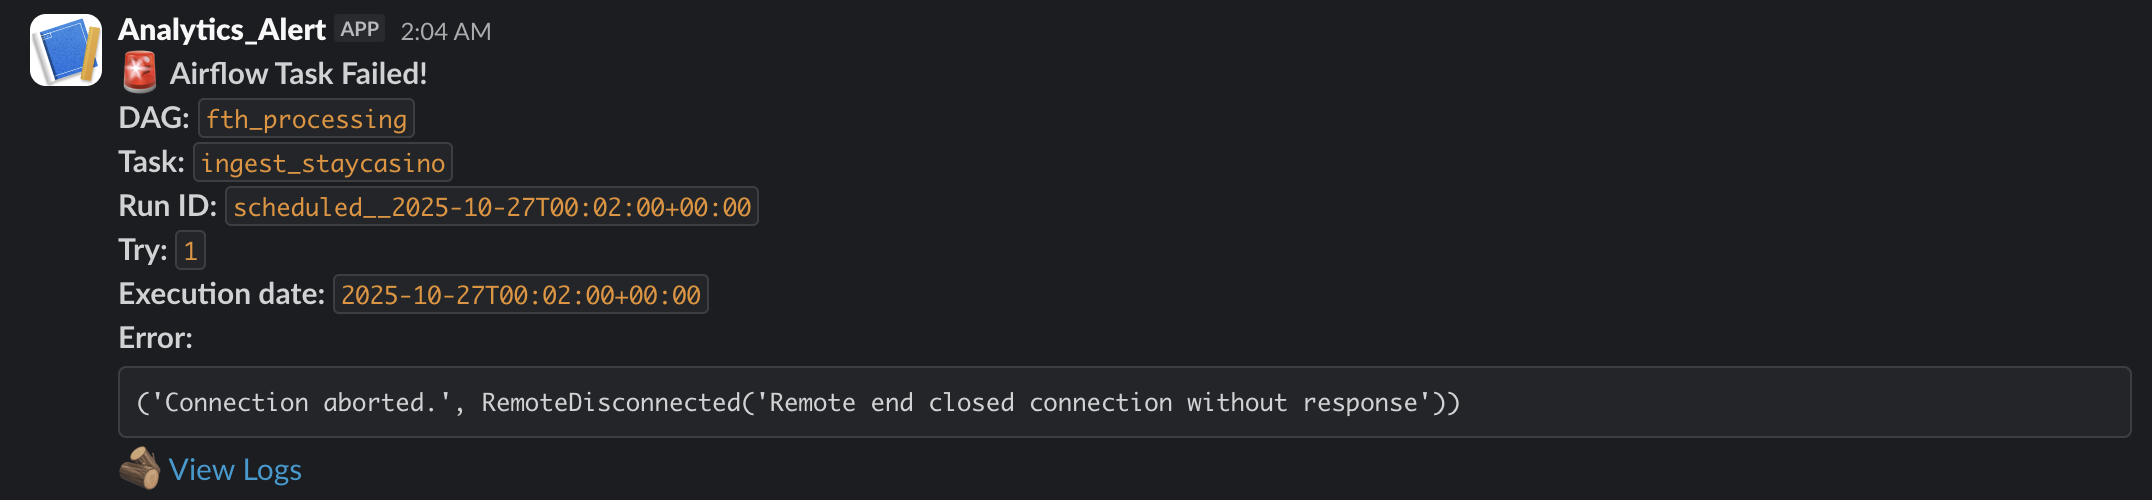
It contains name of the dag, failed task name, run id, try number, timestamp when task started, error description and link to logs.
For not user related fails - network issues, git sync fail implemented 1 retry (to not block downstream dags if issue presists) with 5 minutes cooldown. If the second try still fails dag needs to be rerun manually and then the processing (currently via Scheduled Query in BQ, later will be implemented via dags).
Dag structure
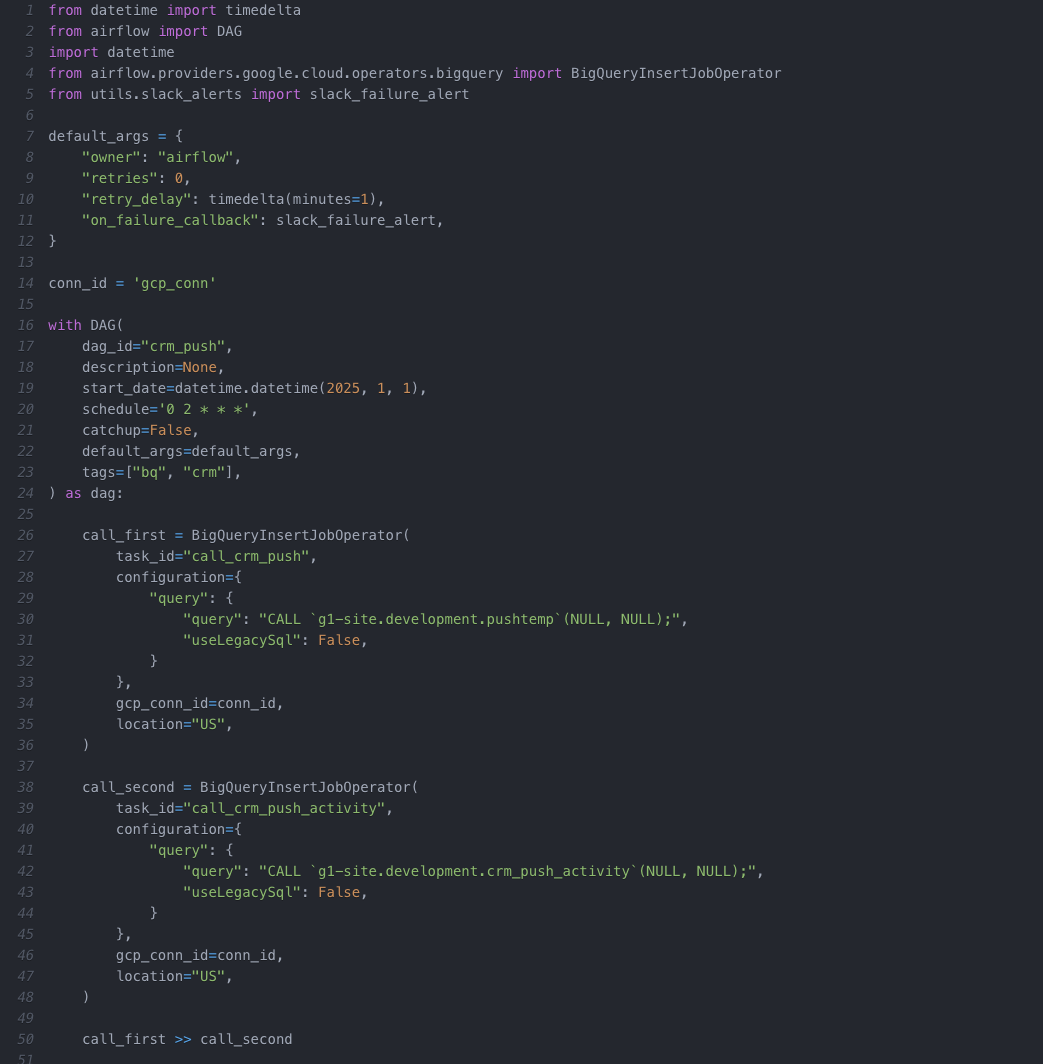
Libs import;
default_args definition - number of retries, cooldown between retries, alerting function call;
Setting connection (added in Admin → Connections page);
Dag definition - dag_id (unique name shown in Dags page), description (optional), schedule (cron is advised '15 2 * * *' - every day at 02:15 UTC), start_date (from which date dag should be run, defined by Airflow Scheduler), catchup (default value is False, if set to True and start_date is the 1st of January 2025 Scheduler will schedule run from that date up to now in periods specified in cron), tags;
Task definition - task_id (unique identifier shown in the grid), callable python function or in this case configuration (actual command that will be executed), in BQ case connection name and location;
Task ordering - ‘>>’ means call_second will run after call_first succeeds, if the first task fails the second one will get Upstream_failure, also tasks can be put is array [call_first, call_second] (order doesnt matter) in that case they wil be executed in paralel;
Attachments:
 image-20251027-173328.png (image/png)
 image-20251027-173716.png (image/png)
 image-20251027-174738.png (image/png)
 image-20251027-174956.png (image/png)
 image-20251027-181222.png (image/png)
 image-20251027-181559.png (image/png)
 image-20251027-182239.png (image/png)
 image-20251027-182522.png (image/png)
 image-20251027-182757.png (image/png)
 image-20251027-183140.png (image/png)
 image-20251027-185224.png (image/png)
